

You have the material: a report, meeting notes, a spreadsheet, or a document someone wants turned into slides by tomorrow. The challenge is deciding what belongs on the screen—and how to show it without creating another wall of text.
Effective visual presentations make that decision easier for your audience. They reveal a comparison, explain a process, or show evidence behind a conclusion. A useful chart or annotated screenshot can do more than several paragraphs, provided it supports the point you need to make.
This guide walks through practical visual presentation examples, how to choose the right format, and a workflow for turning your content into clearer slides with PPT Maker.
What Are Visual Presentations?
Visual presentations combine concise text with images, charts, diagrams, and other visual elements to communicate a message. The visuals carry part of the explanation rather than simply decorating the page.
A project update, for example, might use a timeline to show where a delay occurred. A training deck could demonstrate a task through annotated screenshots. In both cases, the audience can see something they would otherwise have to reconstruct from words.
How Visual Presentations Differ from Text-Heavy Slides
A text-heavy slide often behaves like a document projected onto a screen. The presenter talks while everyone tries to read ahead.
A visual presentation divides the work more deliberately. The slide shows the key relationship or evidence; the speaker supplies context and explanation.
That distinction matters when preparing your material. A deck emailed for independent reading needs more explanation than one delivered live. Trying to make the same slides serve both purposes often produces crowded pages that are difficult to present and incomplete as documentation.
What Makes a Visual Presentation Effective?
An effective slide gives the audience a clear starting point. Its headline establishes the message, and its most prominent visual helps explain or support it.
Imagine a slide titled “Customer Support.” It could contain almost anything. “Most Support Requests Occur During Account Setup” gives the audience a specific idea to examine.
The visual beneath that headline should make the pattern visible. A generic photograph of a support team would add little; a chart showing requests by customer stage would help explain the problem.
Which Visual Type Fits Your Message?
Choosing visuals becomes simpler once you identify what the audience needs to understand. Start with the relationship in your content, then find a format that reveals it.
Charts for Comparisons and Trends
Use charts when the message depends on numbers. Bars help compare categories; lines reveal changes over time.
Suppose your spreadsheet contains monthly revenue across several regions. Before copying the entire table into a slide, decide what matters: the strongest region, a recent decline, or a change in the overall trend.
That decision determines which data to display and where to direct attention. Keep the units, time period, and relevant labels visible. Visual presentations lose credibility when simplification removes the information needed to interpret a chart.
Flowcharts for Processes and Decisions
Instructions become easier to follow when people can see the sequence and its branches.
An onboarding process might move from registration to verification, then split depending on whether the customer needs assistance. A flowchart exposes that decision point more clearly than a paragraph describing every possibility.
Keep each step brief. If the diagram needs several sentences inside every box, separate the overview from the detailed instructions.
Timelines for Sequences and Milestones
Timelines work well when timing is central to the message.
For a launch plan, show the milestones, dependencies, and dates that affect the decision under discussion. Avoid squeezing every task from the project tracker onto one slide.
A presentation timeline should help someone understand the plan. The tracker can hold the operational detail.
Diagrams for Relationships and Systems
Use diagrams to explain how parts connect: teams within an organization, components in a product, or information moving through a system.
The connections deserve as much attention as the boxes. Label an arrow when its meaning is unclear. Does it represent approval, ownership, or data transfer? Your audience should not have to guess.
Photos and Screenshots for Context and Demonstrations
A photograph can establish real-world context. A screenshot can show exactly where to click or what an error looks like.
Crop screenshots around the relevant area and annotate the action. An entire desktop captured at a tiny scale rarely helps someone complete a task.
For customer stories or product demonstrations, specific images usually contribute more than loosely related stock photography.
Video and Animation for Showing Change
Motion is useful when the change itself matters. A short recording can demonstrate a product interaction; a gradual reveal can explain how a system develops.
Choose it when a static image would leave an important question unanswered. Also consider how the presentation will be delivered: a video that works on your laptop still needs testing on the meeting-room computer.
Visual Presentation Examples: Before and After
The most useful visual presentation examples show how content changes during editing. These illustrative situations demonstrate the decisions behind the finished slide.
Turn a Dense Paragraph into a Clear Takeaway and Supporting Visual
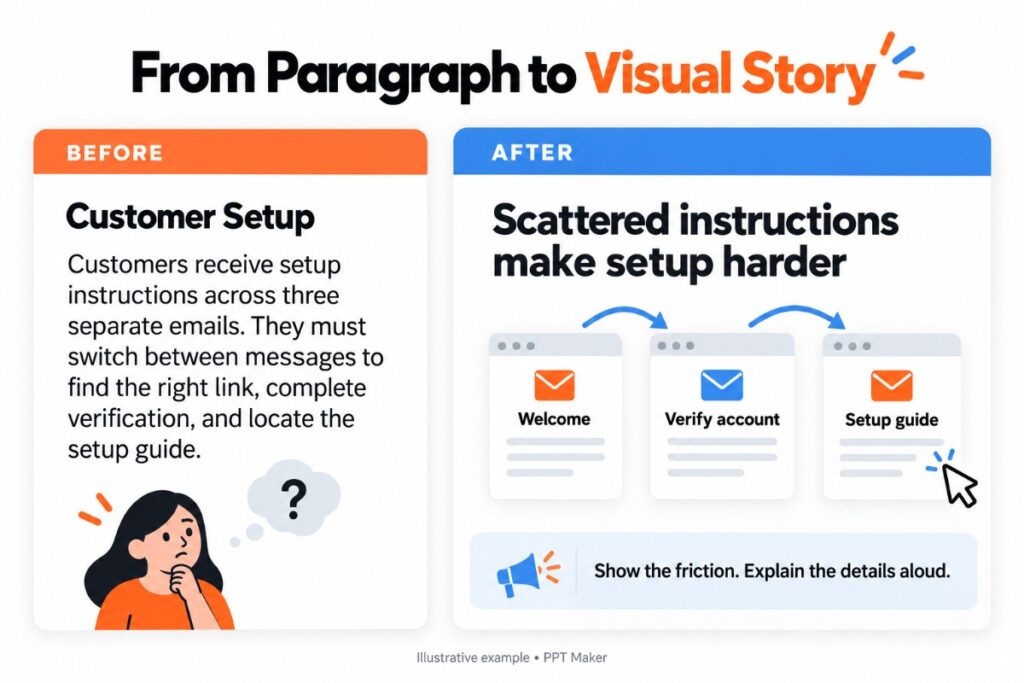
Consider an internal update explaining that customers abandon setup because instructions arrive across several emails.
The original slide repeats the paragraph, perhaps with a bold heading. A stronger version uses a conclusion such as “Scattered Instructions Make Setup Harder to Complete,” supported by a simple diagram of the current journey.
The audience can see the fragmented experience. Details about individual emails belong in the explanation or supporting material.
This is a practical answer to how to make a presentation more visual: identify the relationship hidden inside the paragraph and show it directly.
Turn a Data Table into a Chart That Highlights the Main Insight
A sales update contains figures for every product and month. The meeting, however, is about which product needs attention.
Replace the full table with a comparison focused on that decision. Highlight the relevant product, retain enough context to make the comparison fair, and write the finding in the headline.
Keep the complete table in an appendix if colleagues need to inspect individual values. Clear visual presentations make evidence accessible without requiring every detail to appear at once.
Turn Written Instructions into a Step-by-Step Diagram
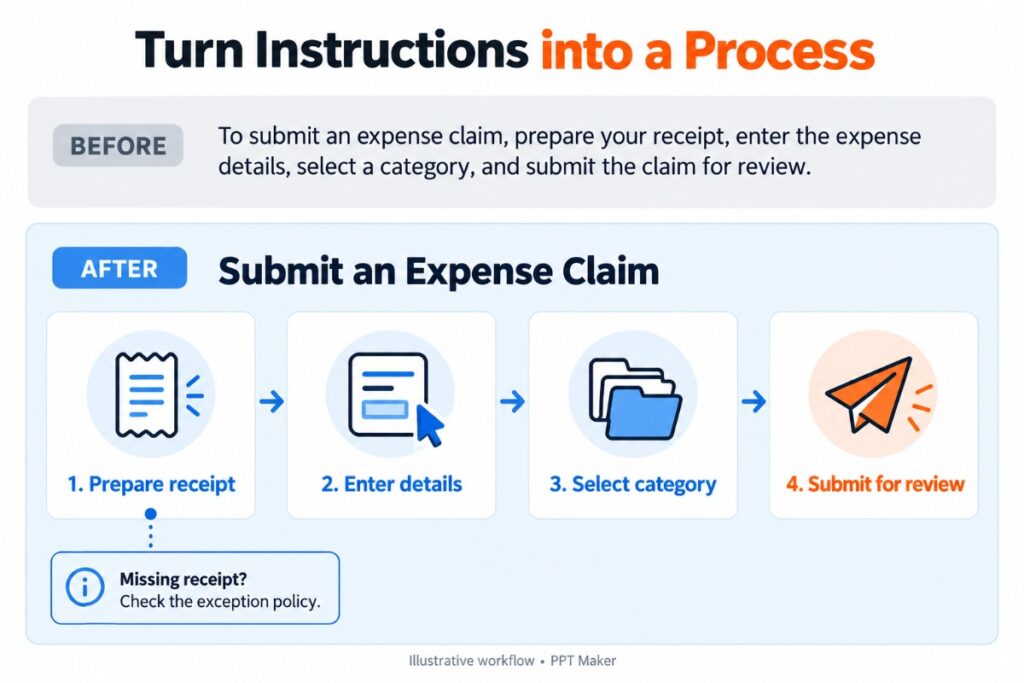
A training slide explains how to submit an expense claim in a long paragraph.
Rebuild it around the actions: prepare the receipt, enter the details, select the category, and submit. Pair the sequence with cropped screenshots where users commonly get stuck.
An exception—such as a missing receipt—may deserve a separate slide. Forcing the standard process and every exception into one diagram makes both harder to follow.

Turn a List of Options into a Side-by-Side Comparison
A proposal describes three service packages in separate blocks of prose. Readers have to remember each description while comparing the next.
Align the options against the same criteria instead: intended user, included support, implementation effort, and price.
A clear comparison may be a table rather than an elaborate graphic. The goal of a visual presentation is easier understanding, not maximum illustration.
How to Create a Visual Presentation from Your Content
Once you understand the available formats, the next task is building a repeatable workflow. Separating content decisions from formatting reduces the chance of polishing slides that later need to be rebuilt.
Define Your Audience, Purpose, and Delivery Format
Before opening a slide editor, finish this sentence: “After this presentation, the audience should…”
Perhaps they should approve a budget, understand a process, or choose between two approaches. That outcome helps you decide what to include.
Confirm the delivery requirements early, too. A client who needs to update numbers in PowerPoint has different needs from a colleague who only wants a readable PDF. Discovering that distinction after designing the entire deck creates avoidable rework.
Build Your Outline Around Key Messages
Read through your source material and pull out the conclusions that move the audience toward the intended outcome.
A useful outline might move from the problem to its evidence, then to a proposed response and the decision required. The sequence should reflect your actual argument.
Read the proposed slide titles together. If they feel disconnected, rearrange the story before choosing colors or images.
Give Each Slide a Clear Takeaway
Each slide needs a manageable job.
If a page introduces the problem, compares solutions, and explains implementation, split it. Additional slides can make a presentation easier to follow without necessarily making it longer to deliver.
Write headlines that say something meaningful. “Implementation Plan” names a topic. “Start with One Team Before Expanding” communicates an approach the audience can discuss.
This step often improves visual presentations more than adding another graphic.
Choose Visual Evidence That Supports the Takeaway
Match the visual to the claim. A statement about growth needs data; an explanation of a workflow needs a sequence; a usability problem may need a screenshot.
Avoid asking a decorative image to prove something it cannot demonstrate.
When data is involved, work from the original values. Check any generated chart against its source rather than accepting a convincing-looking image as accurate evidence.
Keep Essential Labels and Move Supporting Detail into Notes
Editing should remove distraction without stripping away meaning.
Chart labels, units, definitions, and important qualifications may need to remain on the slide. Long background explanations can move into speaker notes or an appendix.
If the deck must stand alone, include enough written context for someone to understand it without you. Learning how to create a visual presentation includes knowing when additional text is necessary.
Apply Consistent Layouts, Fonts, and Colors
Once the structure works, establish a small set of repeatable layouts.
A recurring position for headlines, consistent chart labels, and predictable spacing make the deck easier to scan. They also reduce the time spent adjusting individual objects.
For ongoing team presentations, use a shared template with defined layouts. A reusable structure is especially valuable when the same report returns next month with different numbers.
How to Use PPT Maker to Build and Refine Your Slides
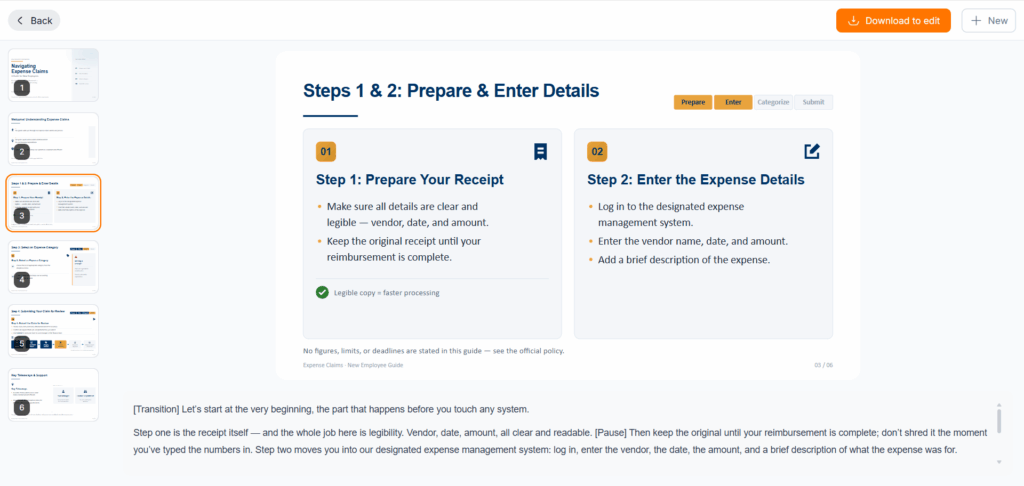
PPT Maker can help move your source material into an initial deck. The most productive workflow still includes reviewing the structure, refining the visuals, and checking the finished content.
Start with Your Topic or Source Material
Begin with the material you actually need to communicate, such as notes, text, or a PDF. Give the task a clear purpose rather than relying on a broad request like “make a professional presentation.”
For example, describe the audience, the decision they need to make, and the information that must remain unchanged. Cleaner input gives you a stronger basis for reviewing the result.

Review the Structure and Visual Direction
PPT Maker’s Agent and Creative options provide different starting points for organizing content and developing visually rich slides.
Whichever route you use, inspect the sequence before polishing individual pages. Does the deck reach the main point quickly? Are repeated ideas taking up space? Has necessary context disappeared?
Treat the first result as a draft of your visual presentation, with the source material beside it for comparison.
Refine Individual Slides and Verify the Content
Make revision requests specific. “Emphasize the difference between these two options” gives a clearer direction than “make this better.”
Work through pages that need attention, checking names, figures, labels, and claims as you go. Preserve wording that has already been approved.
Before depending on a particular editing or export workflow, check how the available output handles the elements you need. A slide that looks finished may still need adjustments for the recipient’s software.
Check Your Visual Presentation Before Sharing
A final review should test whether the presentation works for its audience and its destination.
Can Your Audience Read and Understand Each Slide?
View the deck at presentation size, preferably on the screen you will use.
Small labels that look comfortable on a laptop may disappear when projected. Check contrast, explain unfamiliar abbreviations, and avoid relying on color alone to distinguish categories.
Ask someone unfamiliar with the material what they think the main message is. Their answer can reveal ambiguity you no longer notice.
Do the Visuals Accurately Support Your Claims?
Compare charts, diagrams, and captions with the original material. Check that highlighted data actually supports the headline and that simplified processes retain important conditions.
Keep useful annotations. A cleaner slide is only an improvement if it remains accurate.
Can the Recipient Edit What They Need to Change?
If someone else will maintain the deck, test a realistic edit: change a headline, update a value, or replace an image.
Check whether the relevant elements remain editable. A file opening successfully does not guarantee that updating it will be straightforward.
Does the Presentation Work in the Final Format and Setting?
Open the final file in the destination application. Test videos, links, fonts, and any offline requirements. Keep a suitable backup for the presentation setting.
Visual presentations succeed when the message stays clear throughout the workflow—from the first outline to the audience’s screen. Build around that message, use visuals to explain it, and verify that the finished deck can do the job it was created for.